Association Rule Mining
Association Rule Mining
Association rule mining is a data mining technique used to discover interesting relationships or patterns among a set of items in large datasets. It is commonly used in market basket analysis, where the goal is to identify sets of products that frequently co-occur in transactions.
Data Formatting for Association Rule Mining
To perform association rule mining, the data must be formatted into a transaction format. Each transaction is represented as a list of items, and the dataset is typically stored in a binary matrix format where rows represent transactions and columns represent items.
The data that I am using is already vectorized with Scikit-Learn's Count Vectorizer.
Here is an example of how the data looks:

Key Concepts
- Support: The support of an itemset is the proportion of transactions in the dataset that contain that itemset. It indicates how frequently the itemset appears in the dataset.
- Confidence: Confidence measures the likelihood of the consequent given the antecedent. It is calculated as the ratio of the support of the itemset to the support of the antecedent.
- Lift: Lift measures how much more likely the consequent is to occur when the antecedent is present compared to when it is absent. A lift value greater than 1 indicates a positive association between the items.
This was my Apriori model:

Minimum support and Confidence can be adjusted to find differing rules with the data set.
Originally I had way too broad settings and my model was making 51 million rules, sure enough I hit a 16GB limit and needed to find something insightful, this underscores why hyperparameter tuning is important and can drive where analysis ends up.
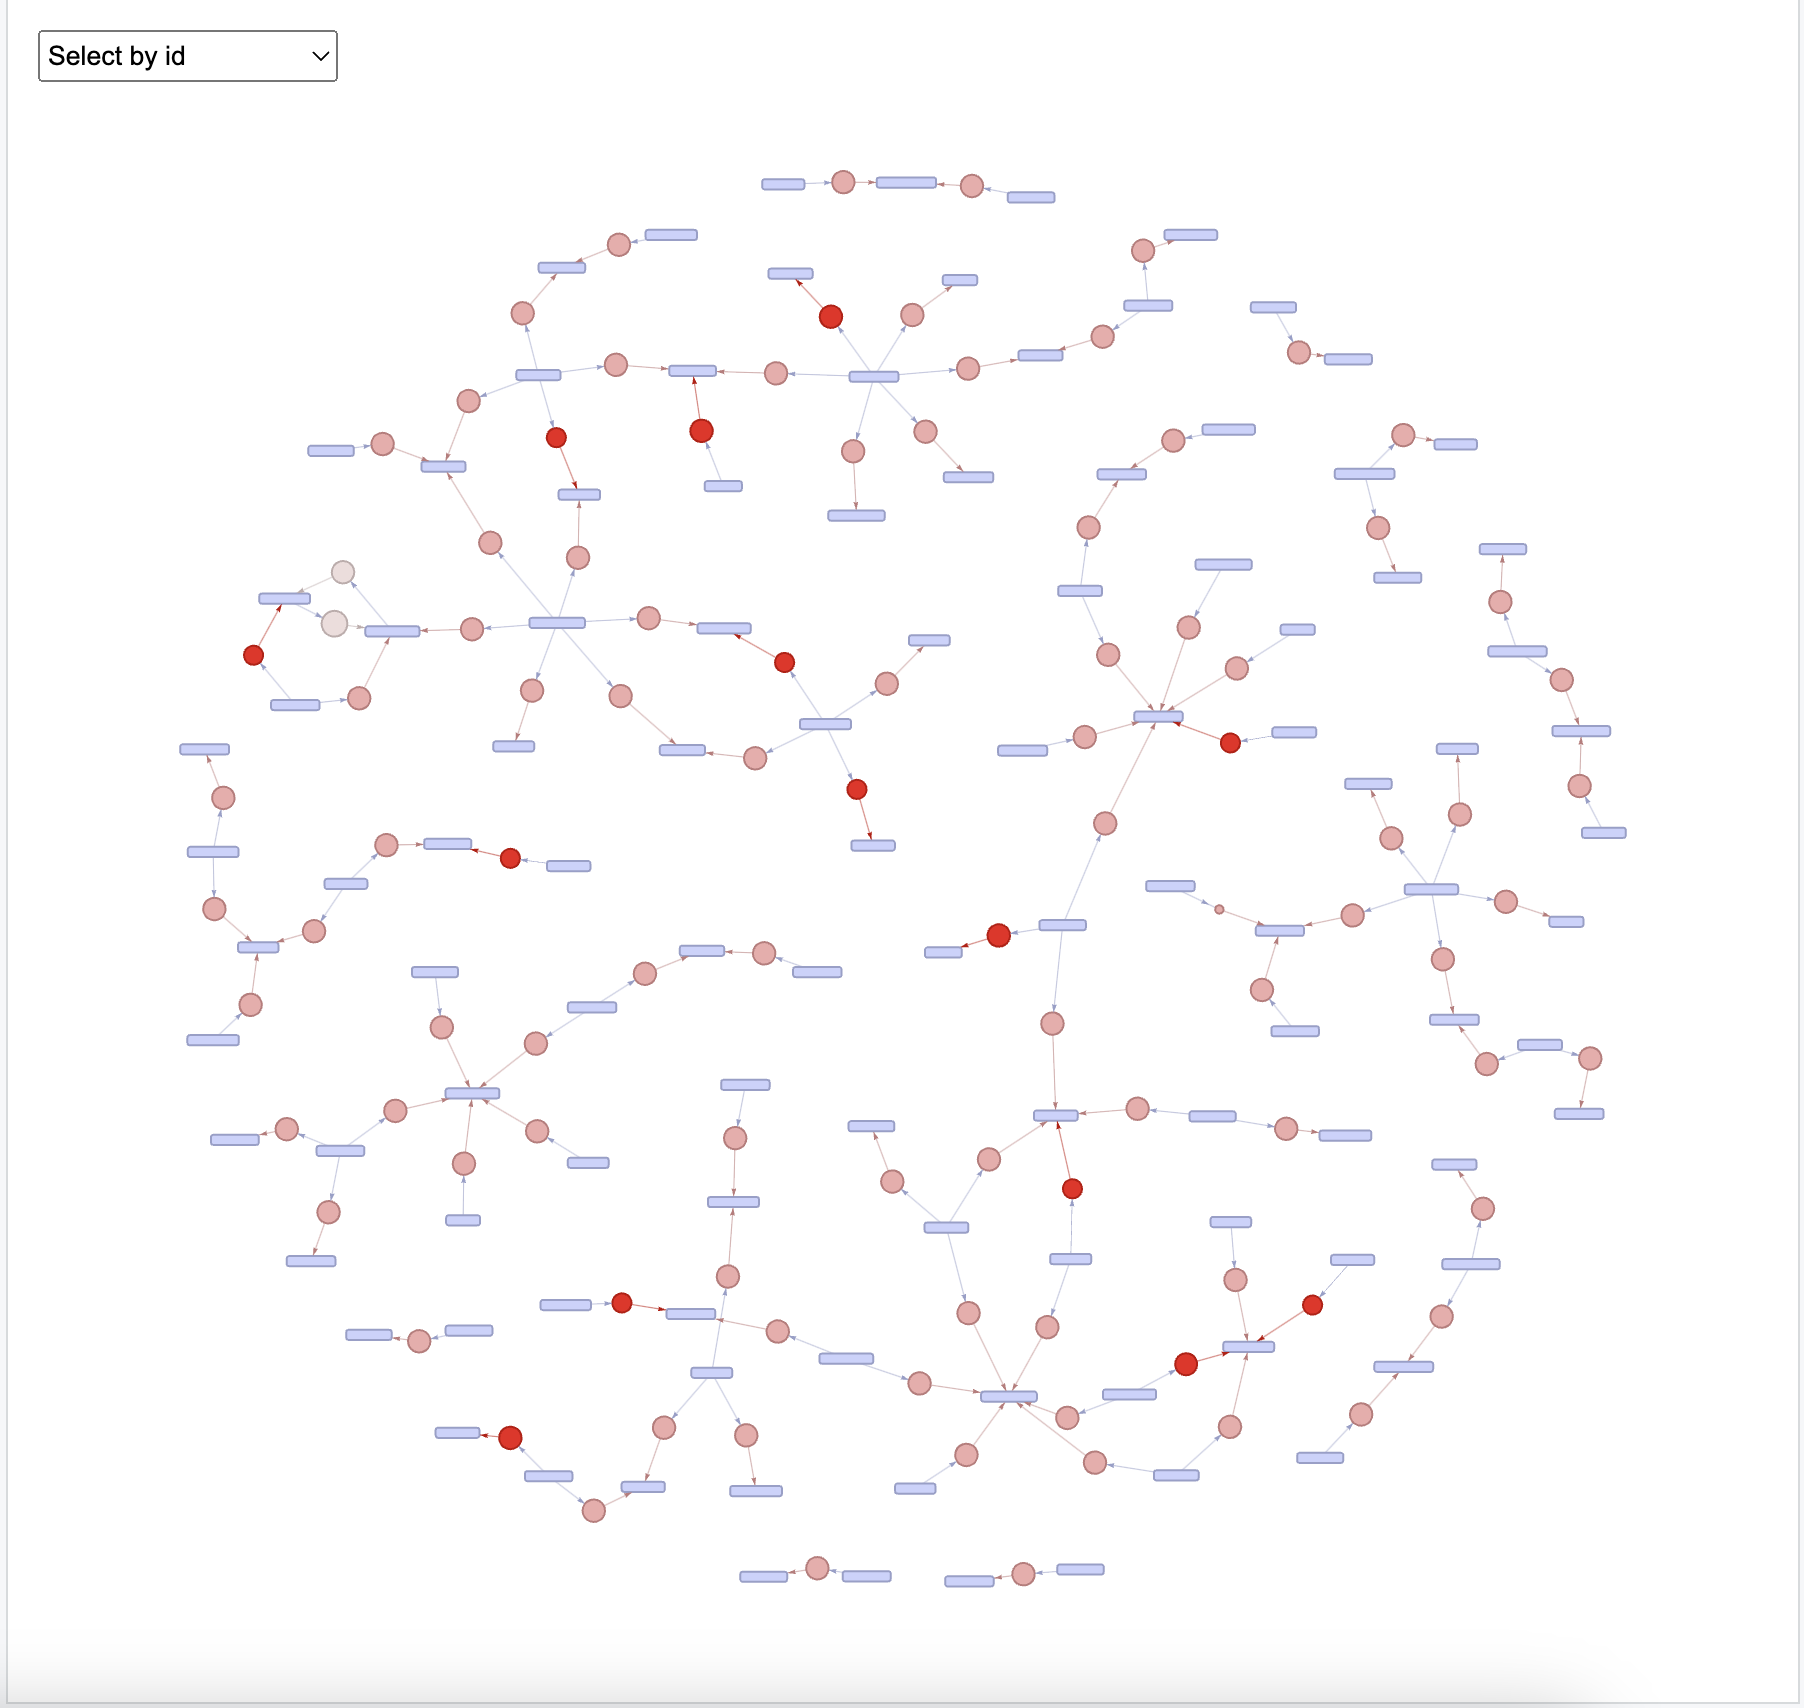
Network Graphs
Network graphs are a powerful way to visualize the relationships between items in association rule mining. Each node represents an item, and edges represent the strength of the association between items. The thickness of the edges can indicate the strength of the association, while the color can represent different categories or types of items.
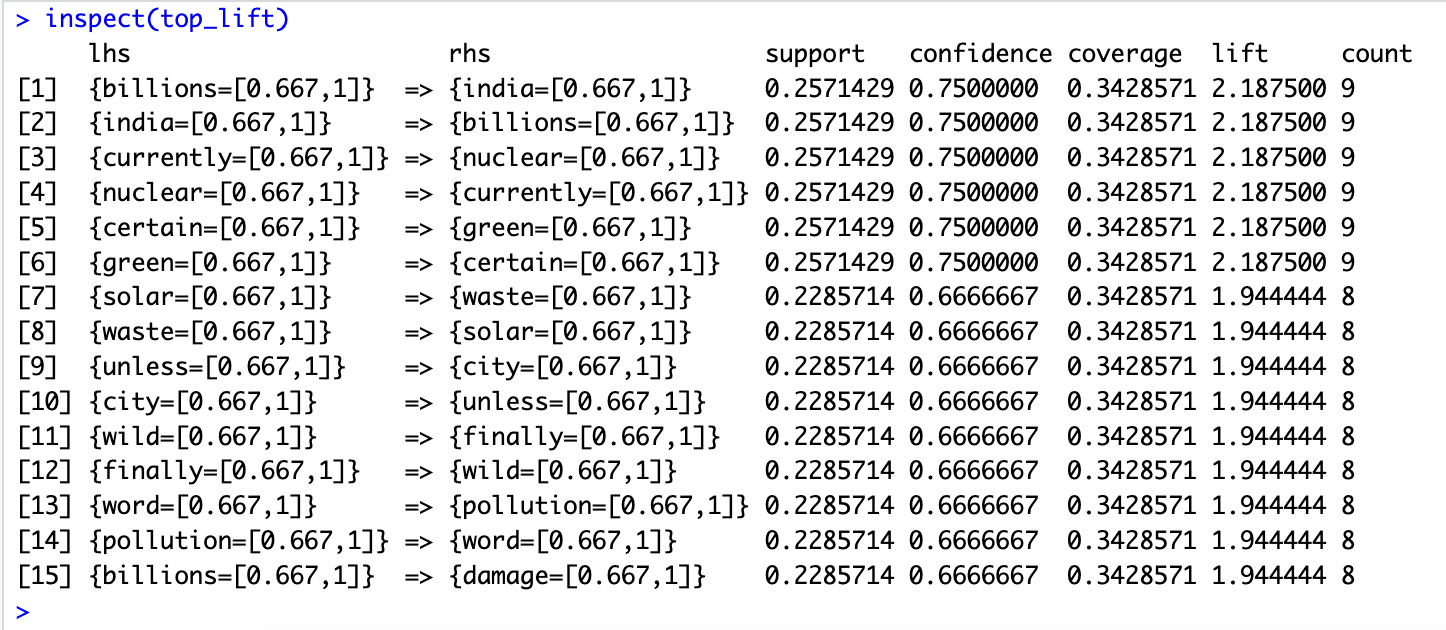
Then limiting the rules to the top 15:

Thematic Connections
- Solar is most strongly connected to waste — a lesser-known environmental concern.
- Nuclear and currently frequently co-occur, reflecting current debates around nuclear energy as a climate solution.
Geographic Framing
- India and billions form a strong bi-directional link, showing that discussions often involve scale — either economic or population-level impacts.
Public Confidence or Doubt
- Words like certain paired with green could reflect certainty or skepticism about green initiatives.
Emotional or Urgent Language
- Pairings like unless ⇄ city suggest conditional or urgent phrasing in climate discussions (e.g., “Unless cities act now...”).
- Pairings like unless ⇄ city suggest conditional or urgent phrasing in climate discussions (e.g., “Unless cities act now...”).